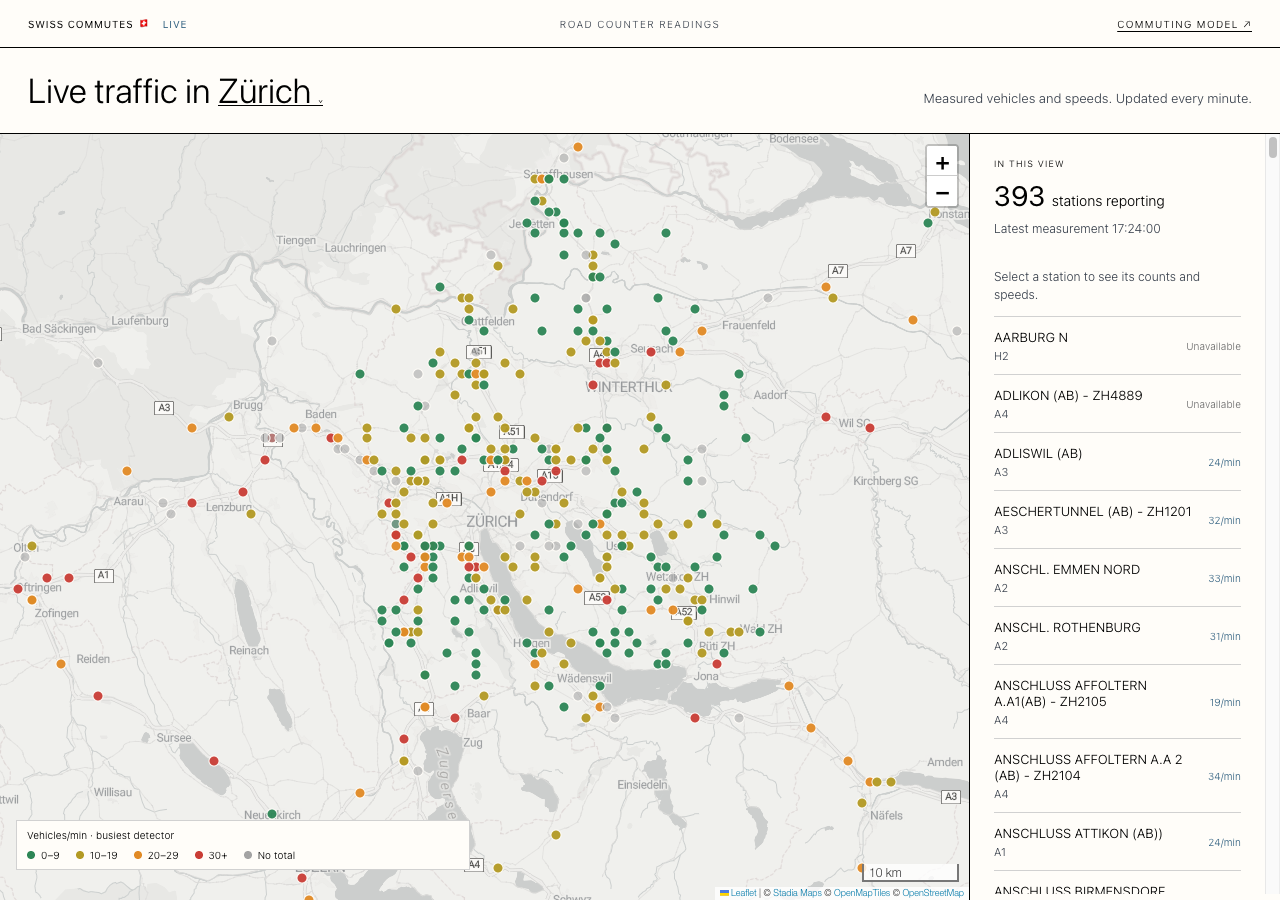
Try the Zürich traffic map here
The commuter map is a model. It takes census counts of where people live and work and builds a plausible day out of them. For this view I wanted something measured. The Federal Roads Office (ASTRA) runs counting stations on motorways and main roads and publishes their readings every minute, so this map shows the newest minute for the stations around each of the 16 cities.
Each dot is a counting station, coloured by how many vehicles its busiest detector counted in that minute: green for up to 9, yellow for 10 to 19, orange for 20 to 29 and red for 30 or more. Grey means the station did not send a complete count for that minute.
Then I made the dots blink. Every marker dims once for each vehicle it counted, so a station that counted 5 vehicles blinks five times a minute and one that counted 40 blinks forty times. With a few hundred stations blinking at their own pace, the map turns into a Christmas tree. At one in the morning it is almost all green and the lights twinkle slowly. In the evening rush the motorways around Zürich fill with orange and red, and those dots flicker much faster.
The numbers behind those two pictures: at 17:24 on Thursday 10 September, 393 stations in the Zürich view were reporting, with a good share of orange and red. At 01:04 on Sunday 4 October, 397 of the 439 stations in the same view had a count, and nearly all of them were green.
Clicking a station shows that minute's counts and average speeds, split into light vehicles (cars, motorcycles, buses and small delivery vehicles) and heavy goods vehicles. The blinking stops at 120 vehicles a minute, two per second, which keeps it below the three flashes per second that accessibility guidelines allow. Above that the marker just stays lit. If your system is set to reduce motion, nothing blinks.
Data Sources & Methodology
The readings come from ASTRA's road traffic counters API on opentransportdata.swiss, in DATEX II format. The source reports flow in vehicles per hour for each detector over a one-minute interval. I divide by 60 to get back the count for that minute, and I drop any reading that does not come out as a whole number instead of rounding it. Only 60-second intervals are used.
Readings flagged as errors, test or forecast data are excluded. A measured zero stays zero and a missing reading stays grey. I never borrow a value from a neighbouring station or an earlier minute. Light and heavy vehicles are reported separately, and a detector needs both to have a total.
Stations are never added together, because one car can cross several counters on the same trip. The counts are vehicles, not people, and include every kind of trip, not only commuting. The colours describe volume. They say nothing about congestion or how much a road can carry.
A PHP script on my server collects the newest minute once a minute, about 25 seconds past the minute, a few seconds after the source publishes it. The source cannot send old minutes, so if a collection fails the map keeps showing the last minute it has, and the time above the map says which minute that is. Station names come from the ASTRA map directory, matched by counter ID. Coverage varies by city, and the counters do not reach every street or the roads on the other side of the border.
