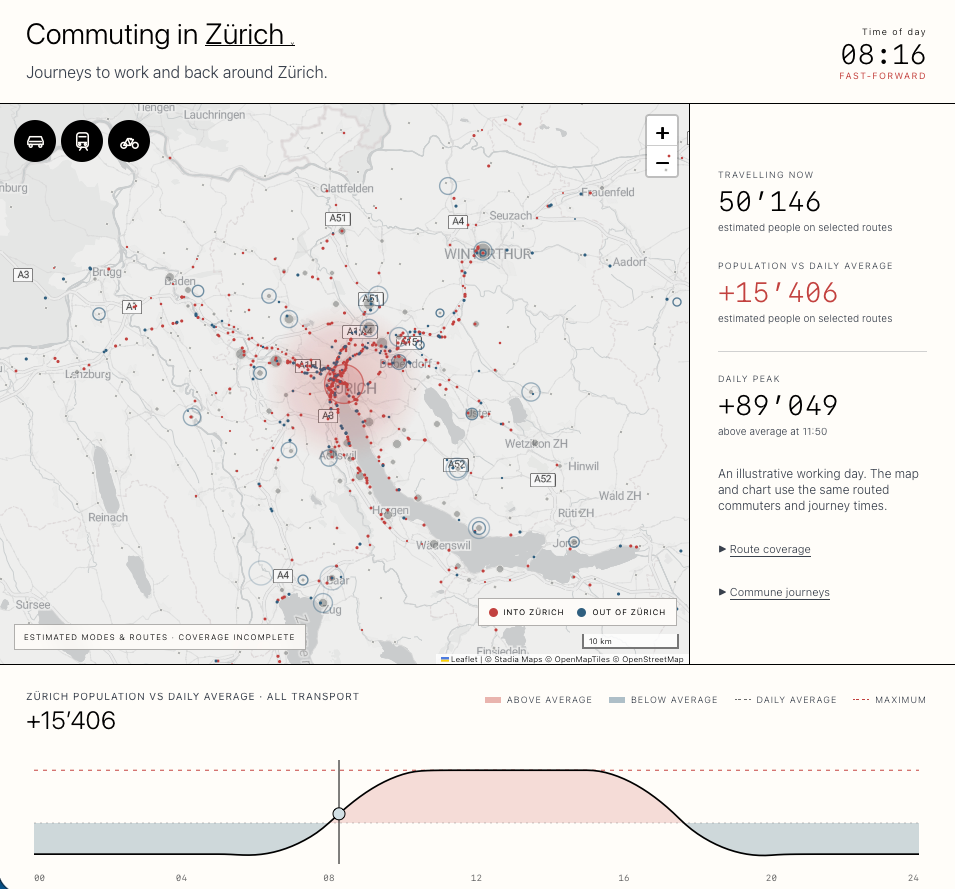
Try the Geneva map here https://www.danielpradilla.info/swiss-commutes/geneva/
I was inspired by Habibi Code’s commuter map, shared in this r/geneva post – it’s hipnotic to see the dots converge on Geneva.
Being a Geneva commuter myself I am acutely aware of the international commutes that taks place in major Swiss border towns. So I took the top 10 Swiss cities, and then some smaller ones that I considered relevant, and built my own version.
The page opens at 07:45, with the morning commute already under way, and runs fast forward. You can control the time with a slider and make it real time.
I added colors to the commuters, red means flow into the selected city, blue out. Transport modes have their own filters. The chart shows the modelled commuter contribution to population relative to its daily average. You can also inspect commune journeys and see how much of the source data actually made it onto the map.
In the case of Geneva, my source cohort contains 149,171 people before mapping and routing exclusions: 118,892 from France, 23,398 from Vaud, and 6,881 travelling from Geneva to Vaud. Journeys entirely within Geneva and connections with other Swiss cantons are excluded. Habibi’s code includes a large Geneva-origin group and shows about 386,000 commuters overall.
Try the Geneva map, then switch cities or turn off a transport mode. The source and method notes explain what went into the view, including the journeys it leaves out.
Data Sources & Methodology
I start with home and workplace communes. For domestic Swiss journeys, I use the FSO commune matrix, with 2020 counts. Geneva’s French flows come from weighted INSEE 2023 census records, filtered to Ain and Haute-Savoie and aggregated by home commune, workplace commune and transport category. Geneva–Vaud pairs are scaled to OCSTAT’s 2024 totals. Other cities use cross-border totals from the fourth quarter of 2025. The years remain visible in the source notes because this combination is not a census of one particular year.
The detail varies considerably. Geneva’s French records identify home communes and usual transport modes. For other cities, foreign home locations often have to be allocated using population and distance. On Vaud–Geneva journeys, the survey’s unspecified category stays unspecified and is excluded from the three mode filters. I would rather leave that gap visible than turn it into an invented cyclist.
Car and motorcycle journeys use Valhalla routing, with separate trips to work and home. Walking and cycling also use routed paths, with a distance rule choosing between them. This supplies a plausible path and travel time, but of course it cannot establish how a particular person travels. Endpoints approximate settlements or town halls, since the statistical records do not provide home and office addresses.
For rail, I use Switzerland’s NPVM 2023 network and the passenger-station register. Geneva also has sample outward and return itineraries from the Swiss 2026 timetable, including cross-border services and transfers. A valid sample itinerary establishes a possible connection. It does not tell me which departure every commuter takes. Public-transport coverage remains uneven, particularly outside Geneva.
The clock requires another assumption. Departures are distributed in morning and evening waves, from 05:00–10:00 and 15:00–20:00. Route durations determine when people arrive. Everyone in the model travels on this illustrative day, without adjustments for holidays, remote work or shifts. The Now button selects the current Swiss time in that model, the site receives no live traffic feed.
Each moving dot represents a group: up to 50 people for cars and motorcycles, and up to 200 for other modes. Those are people, so the car dots cannot be read as vehicle counts.
