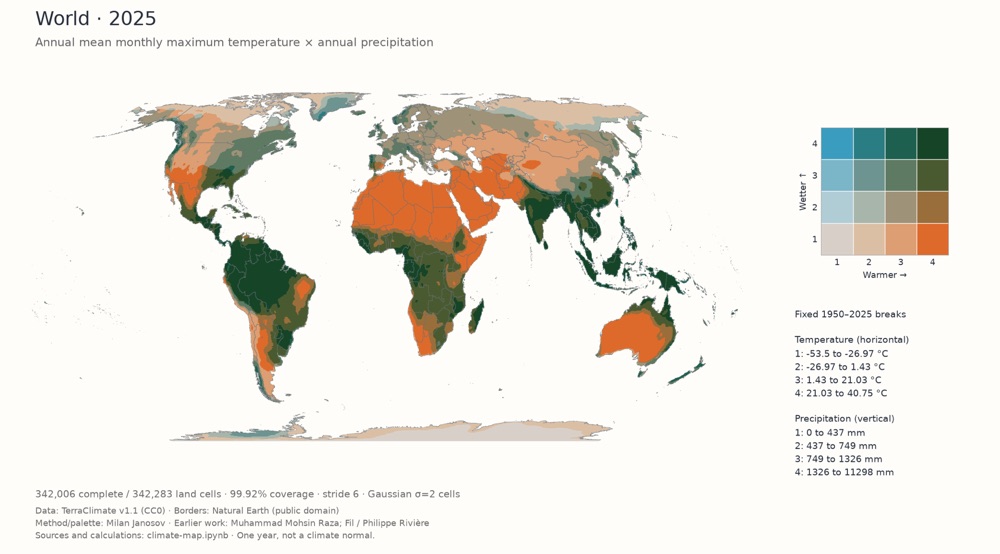
World, 2025: annual mean maximum temperature and annual precipitation. The interactive map has the full legend and every year from 1950 to 2025.
I adapted Milan Janosov’s bivariate climate map into an interactive map for Europe, the other continents and World. It shows annual temperature and precipitation together with a 4×4 color palette. Janosov’s tutorial builds on earlier work by Muhammad Mohsin Raza and Fil / Philippe Rivière. And both are fantastic, very inspirational.
The data comes from TerraClimate v1.1 for every year from 1950 to 2025. Temperature is the mean of the twelve monthly maximum temperatures; precipitation is the annual total. Each region’s thresholds stay fixed across the years, so a color means the same ranges in 1950 and in 2025. Thresholds differ between regions, and the World view puts all continents on one scale.
You can play through the years, inspect a city or a point on the map, turn smoothing off and download the current frame as a PNG.
One detail in Antarctica is unresolved: a straight color boundary runs out from the South Pole. It appears in both the interactive map and the notebook output, and I haven’t found its cause.
The code is on GitHub. The step-by-step notebook downloads TerraClimate’s monthly files, calculates the annual values and draws one year’s map for each of the eight views.
