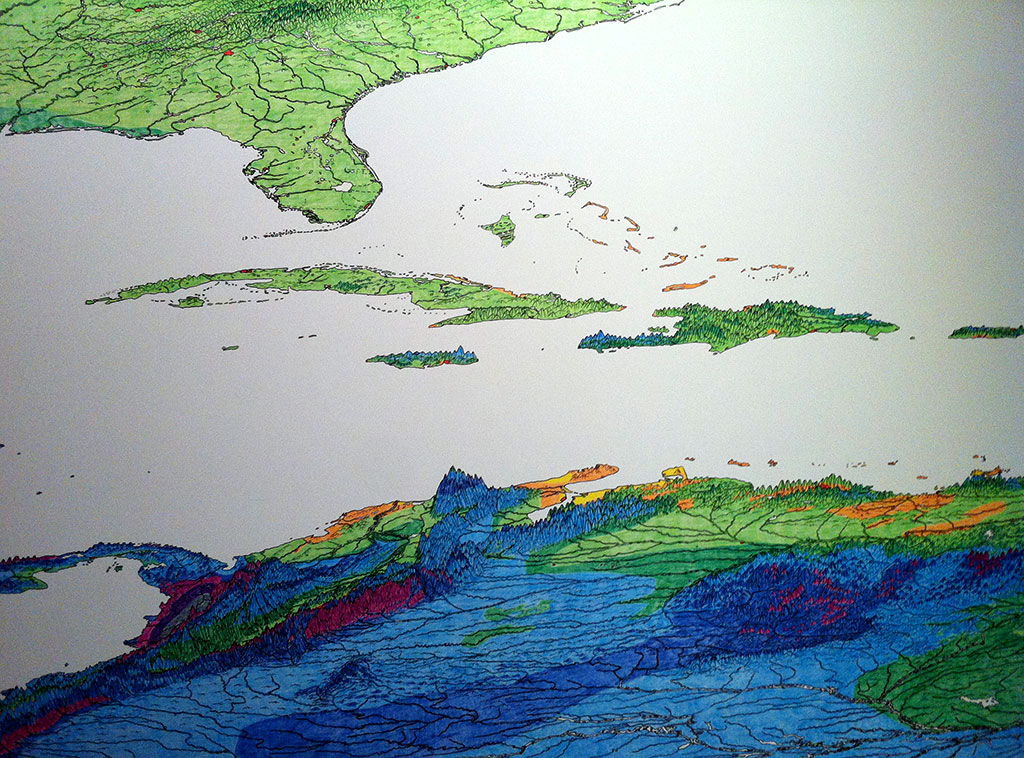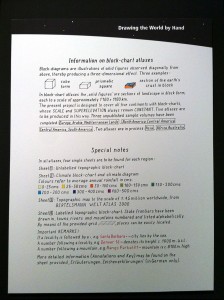
At Lucerne’s Gletschergarten, among old maps, models and reliefs of the Swiss Alps, we’ll find an expo from Ueli Läuppi, a local cartographer that makes hand drawings and colorings of maps using a particular projection that highlights a thorough representation of the mountains.
Moreover, Läuppi has moved his studio to the museum and on certain days you can actually see him completing a precipitation map from an Asian region using a rapidograph and a box with carefully labeled Caran d’Ache color pencils to differentiate rainfall ranges.

Läuppi’s work is at he crossroads between science and art. His extensive research (documented on video) evidences his background as an engineer, and his will power to temporarily move his studio to the museum borders on performance art. It’s also evident that Läuppi knows a thing or two about visualization. His maps are very eloquent when it comes to representing data and explaining their meaning.
Personally, I consider that the staging of this desk in the middle of the exhibition with the rest of the unfinished pieces sends a message: maps are made by people and it’s hard to draw maps.
All of this reminded me of a post about the wireframes and skeletons for web apps and pages and the opinions of some experts who believe presenting sketches instead of perfect lines gives your output a “work in progress†feeling, opening the doors for engagement and getting better and more timely feedback from your clients.
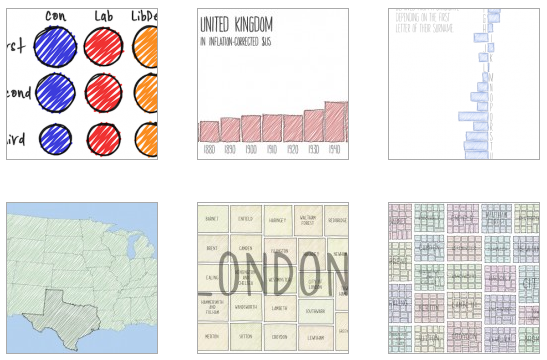
In Sketchy Rendering for Information Visualization, Jo Wood, Petra Isenber, Tobias Isenberg, Jason Dykes, Nadia Boukhelifa and Aidan Slingsby, propose drawing visualizations as if they were made with a marker on a board, in order to communicate that the design is not complete, that is open to criticism and changes, and that visualizations and dashboards represent a narrative in progress. Also, unlike architectural drawings or industrial designs, graphics don’t represent tangible objects, so they don’t need to be accurate. Their goal is to help tell a story. Just as the proverbial business plan written in a napkin, graphics with sketches aim to illustrate a point and it’s ok to sacrifice some accuracy.
The imprecision suggested by sketchy features may reinforce perceptions of simplicity and thus reduce the expectation of cognitive effort required to interpret the visual scene
As part of the method illustrated on paper, authors have created a free library to be used with Processing that provides astonishing results:
They seem hand-drawn, right?
And maybe there’s another key: just as with Läuppi’s maps, these graphics convey the idea that visualization was thought out and made by a human and that there’s meticulous work behind them.
A Handsome Atlas gathers visualizations completed at the end of the XIX century for the US census. These are graphics of great beauty, charts that tell a story and that are truly different from the automatic output done on excel.
We forget that graphics need to be well-thought; that they should communicate something, be memorable and situate themselves between art and science. And although a computer does the rendering job on the screen, when visualizing data we’re also drawing the world by hand.
Läuppi’s expo will be displayed at the Glacier Garden until September 15th of 2013.
